Video
Beyond manufacturing: Integrated services across the product lifecycle
As the renowned statistician and expert authority on electronics modelling, George E. P. Box famously said: “All models are wrong, but some are useful.” This is (probably) true of reliability prediction methods for power conversion modules. Despite this, product data sheets will often give a value for reliability expressed as Mean Time Between Failures (MTBF) and it is common to see claims of tens of millions of hours to three significant digits, based on standard reliability prediction methodology. It is important to note that an MTBF figure applies to components that can be repaired, whereas Mean Time To Failure (MTTF) is used for parts that are discarded upon failure.
Whether repairable or not, it is meaningless to say that a power module will fail, on average, every 1,000 or more years, so what does this measure practically mean? The challenge lies in the fact that modern electronics are inherently so reliable under constant conditions that traditional metrics become unwieldy.
An alternative but equivalent reliability measure is the failure rate of a product per hour, typically expressed as a very small fractional number, such as 10-7 for an MTBF of 1 million hours, so again, not very meaningful for an individual product. A more useful approach has been to express failure rates in FITs (Failures in 10-9 hours), where typical board components may have a few FITs, allowing failure rates to be simply added to get an overall module failure rate.
Another difficulty is even defining failure. Does it mean total loss of function? Or does it refer to a module falling out of its original specification in some minor way, one that may or may not impact the functionality of the end equipment?
Interestingly, reliability figures are only meaningful during a product’s operational life, which is ultimately limited by wear-out mechanisms.
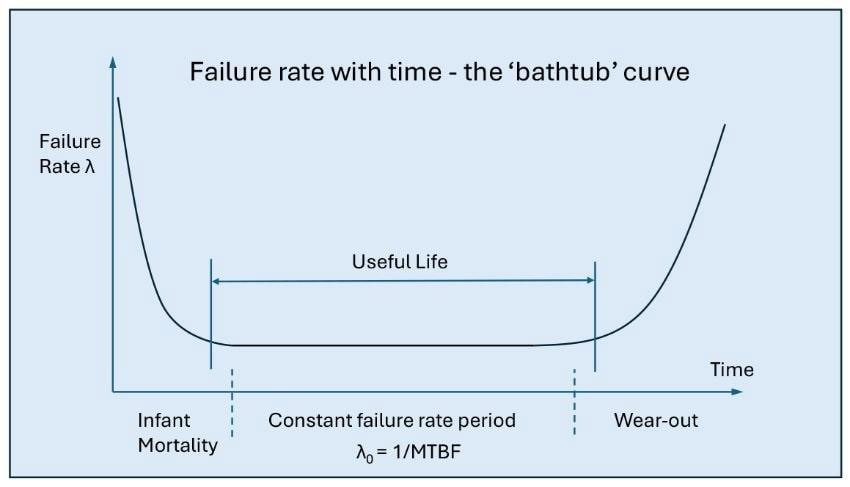
The familiar ‘bathtub’ curve illustrates this, showing a failure rate that remains relatively constant for a period, typically a few years, between an initial infant mortality period and wear-out.
In extreme cases, such as a missile with an operational life measured in minutes, absolute reliability is essential during that brief time, even if its equivalent MTBF is calculated in millions of hours. Operating temperature and environmental conditions must also be factored in. For example, the common MIL-HDBK-217 reliability database defines different environments from ‘Ground Benign’ to ‘Airborne Uninhabited’ and provides different calculation methodologies, such as parts count and parts stress, all of which influence MTBF estimations.
A fundamental assumption is that failures during lifetime are random in occurrence and therefore follow an exponential distribution. This means that the probability of a single part surviving to the MTBF figure is only about 0.37, if it doesn’t wear out first. In a large population of units in service 24/7, say 1,000, if each has an MTBF of say one million hours, during their lifetime, around nine units will fail per year from year one. This may upset the end user who equates a million-hour MTBF to 114 years between failures! This is the reality though, and if you believe the MTBF numbers, then you should plan for the consequences of potential downtime, spare parts holding and rework costs if nine units were to fail each year.
Let’s look at how that MTBF figure is derived. In theory, the ‘real’ field of MTBF could be seen in customer failure reports. However, for low-cost items, the manufacturer may not be informed, and the exact conditions of use may not be known, even by the customer. For example, operating duty cycle may be variable and stress from external factors undefined. A module manufacturer can run accelerated reliability tests at high temperatures. Still, there is no general agreement on the exact acceleration factor, and even then, typically hundreds of modules must be tested for many months to get an MTBF with an acceptable confidence level. The manufacturer must also decide whether to simulate ‘real’ conditions with power, load and temperature cycling, which can give a very different answer.
The least accurate (but paradoxically the most practical) method to determine MTBF is through using established standard calculations. This allows for comparisons between products from different manufacturers, assuming identical operating conditions. However, various reliability standards can produce dramatically different results. Studies comparing calculations using different methods and standards such as MIL-HDBK-217, Telcordia SR332, IEC 61709 (Siemens SN29500), and British Telecom HRD4/5 have found significant discrepancies. Indeed, one study showed a difference in calculated MTBF of more than 10:1 using the MIL and Telcordia methods, for the same DC/DC converter under identical conditions.1
Given these inconsistencies, published MTBF figures for power modules are, therefore, mainly useful as a comparative metric rather than a definitive prediction of actual field performance. In a follow-up blog on our website, we will explore the environmental and electrical stress factors that contribute to real-world failure rates and examine the measures taken by manufacturers such as Flex Power Modules to maximize field reliability.
1. Guidelines to Understanding Reliability Prediction, European Power Supplies Manufacturers’ Association, www.epsma.org